IMPORTANT: These instructions are for older versions of JupyterLab earlier than v3.6.3-4.1.0.
You can find the latest documentation on running an application locally here.
Running your app within Jupyter
It is likely that you will want to preview and test your app before you deploy it.
However because of security implications we cannot allow arbritrary ports to be opened.
Instead, you have to use the /\_tunnel\_/ endpoint we have provided.
Currently the only supported port is 8050, so the url of your app will be /\_tunnel\_/8050/
A few things to bear in mind
- You can only run one app on the 8050 port at a time.
- Your app, by default will only respond to 127.0.0.1 which will not work with the tunnel. You should make sure it responds to 0.0.0.0 instead.
- The base URL of your app will need to be set (while in Jupyter development) to be /\_tunnel\_/8050/ (see the dash walkthrough below for an example)
- Only you will be able to access this url.
In the old system there was support for a range of ports, so it is possible you may not be using 8050 in existing code. Please update your code accordingly.
Running Plotly Dash apps
See Coffee and Coding session on Building webapps in Python using Plotly Dash
Jupyter Lab Version
Dash is known to work with JupyterLab: 3.1.13, Python 3.9 - Git ext. You may run into issues attempting to run Dash with other versions of JupyterLab.
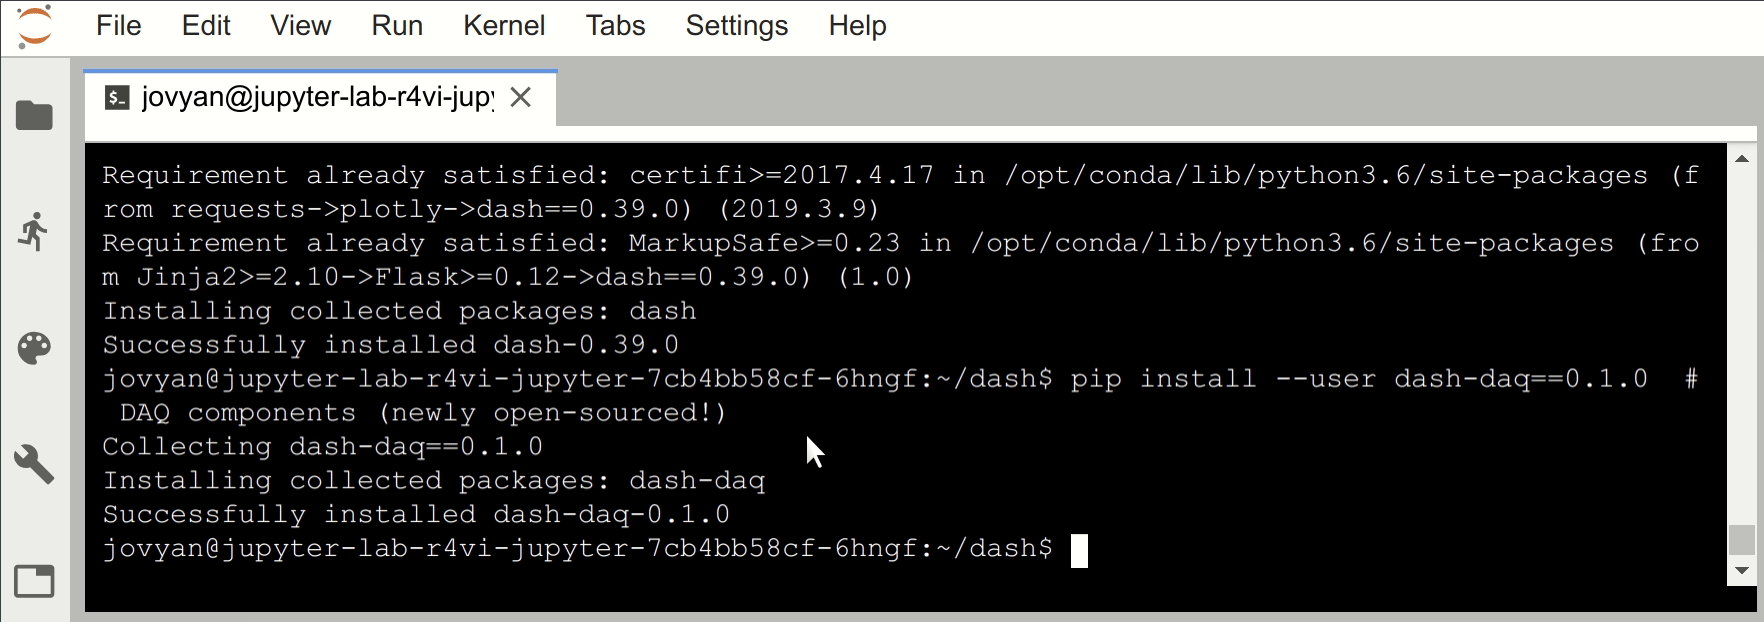
Install dependencies
In the terminal, install the Dash dependencies:
pip install --user dash==2.17.1  # The core dash backend
pip install --user dash-daq==0.5.0  # DAQ components (newly open-sourced!)
The demo code in this document is known to work with these versions but you can install any version you like for your own code.
If you are planning on turning this into a project, you’ll need to manage your
dependencies by adding these to either requirements.txt and pip or
environment.yaml and conda.
Example code
Save the Dash hello world app to a new python file called app.py:
N.B. You will need to have pandas installed for this code to work.
import dash
from dash.dependencies import Input, Output
from dash import dcc
from dash import html
import flask
import pandas as pd
import time
import os
server = flask.Flask('app')
server.secret_key = os.environ.get('secret_key', 'secret')
df = pd.read_csv('https://raw.githubusercontent.com/plotly/datasets/master/hello-world-stock.csv')
external_scripts = [
    'https://cdn.plot.ly/plotly-basic-latest.min.js'
]
app = dash.Dash('app', server=server, url_base_pathname='/tunnel/8050/', external_scripts=external_scripts)
app.scripts.config.serve_locally = False
app.layout = html.Div([
    html.H1('Stock Tickers'),
    dcc.Dropdown(
        id='my-dropdown',
        options=[
            {'label': 'Tesla', 'value': 'TSLA'},
            {'label': 'Apple', 'value': 'AAPL'},
            {'label': 'Coke', 'value': 'COKE'}
        ],
        value='TSLA'
    ),
    dcc.Graph(id='my-graph')
], className="container")
@app.callback(Output('my-graph', 'figure'),
              [Input('my-dropdown', 'value')])
def update_graph(selected_dropdown_value):
    print("test")
    dff = df[df['Stock'] == selected_dropdown_value]
    return {
        'data': [{
            'x': dff.Date,
            'y': dff.Close,
            'line': {
                'width': 3,
                'shape': 'spline'
            }
        }],
        'layout': {
            'margin': {
                'l': 30,
                'r': 20,
                'b': 30,
                't': 20
            }
        }
    }
if name == 'main':
    app.run_server(host='0.0.0.0')
There are two important things to note here, where this code differs from the Plotly Dash example:
The
Dashclass must be instantiated with aurl_base_pathname. This should always be/_tunnel_/8050/e.g.app = dash.Dash('app', server=server, url_base_pathname='/_tunnel_/8050/').When you run the server, it must be bound to
0.0.0.0, e.g.,app.run_server(host='0.0.0.0').
Run server from the terminal
$ python3 app.py
 * Serving Flask app "app" (lazy loading)
 * Environment: production
    WARNING: Do not use the development server in a production environment.
    Use a production WSGI server instead.
 * Debug mode: off
 * Running on http://0.0.0.0:8050/ (Press CTRL+C to quit)
Running streamlit apps
Similar to Dash apps, streamlit apps can also be developed on JupyterLab and accessed via the /_tunnel_/ endpoint.
Jupyter Lab Version
Streamlit is known to work with JupyterLab: 3.1.13, Python 3.9 - add Streamlit (installed). You may run into issues attempting to run streamlit with other versions of JupyterLab.
Install dependencies
In the terminal, install the streamlit dependencies:
pip install --user streamlit==1.36.0 # The streamlit package
Try streamlit hello in your terminal, if you get error like TypeError: bases must be types, then run the following commands to fix it:
pip uninstall protobuf
pip install protobuf==3.20.1
Next, set the following environment variables:
export STREAMLIT_SERVER_PORT=8050
export STREAMLIT_SERVER_ADDRESS=0.0.0.0
export STREAMLIT_SERVER_BASE_URL_PATH=/tunnel/8050/
export STREAMLIT_LOGGER_LEVEL=debug
You can use a config.toml file to set variables at runtime if you wish.
- First create the
.streamlit/config.tomlin your project root directory if it doesn’t already exist Next add the following to the file:
[server]
address = '0.0.0.0'
port = 8050
baseUrlPath = '/_tunnel_/8050/'
Example code
The following code comes from streamlits own website.
N.B. You will need to have pandas and numpy installed for this code to work.
Create a file called app.py and add the following code:
import streamlit as st
import pandas as pd
import numpy as np
st.title('Uber pickups in NYC')
DATE_COLUMN = 'date/time'
DATA_URL = ('https://s3-us-west-2.amazonaws.com/'
            'streamlit-demo-data/uber-raw-data-sep14.csv.gz')
@st.cache_data
def load_data(nrows):
    data = pd.read_csv(DATA_URL, nrows=nrows)
    lowercase = lambda x: str(x).lower()
    data.rename(lowercase, axis='columns', inplace=True)
    data[DATE_COLUMN] = pd.to_datetime(data[DATE_COLUMN])
    return data
data_load_state = st.text('Loading data...')
data = load_data(10000)
data_load_state.text("Done! (using st.cache_data)")
if st.checkbox('Show raw data'):
    st.subheader('Raw data')
    st.write(data)
st.subheader('Number of pickups by hour')
hist_values = np.histogram(data[DATE_COLUMN].dt.hour, bins=24, range=(0,24))[0]
st.bar_chart(hist_values)
# Some number in the range 0-23
hour_to_filter = st.slider('hour', 0, 23, 17)
filtered_data = data[data[DATE_COLUMN].dt.hour == hour_to_filter]
st.subheader('Map of all pickups at %s:00' % hour_to_filter)
st.map(filtered_data)
Run server from the terminal
$ streamlit run app.py
Accessing your app
Access via _tunnel_ URL
Copy your jupyter URL and append /_tunnel_/8050/ to access your running
app.
- If your jupyter URL is https://r4vi-jupyter-lab.tools.alpha.mojanalytics.xyz/lab?,
then your app will be available at
https://r4vi-jupyter-lab.tools.alpha.mojanalytics.xyz/_tunnel_/8050/.
- If your jupyter URL
is https://[GITHUB USERNAME]-jupyter-lab.tools.analytical-platform.service.justice.gov.uk then your
app will be available at https://[GITHUB USERNAME]-jupyter-lab.tools.analytical-platform.service.justice.gov.uk/tunnel/8050/

Who can access the _tunnel_ URL?
Only you can access the URL and it can not be shared with other members of your team. It is intended for testing while developing an application.
Troubleshooting
This feature has been introduced in the v0.6.5 jupyter-lab helm chart. If following this guide doesn’t work for you it is likely that you’re on an older version. Contact us on the #analytical-platform-support Slack channel. Alternatively, contact us by email to request an upgrade.